


-
Behind the numbers of Greg Anderson's Pro Stock elapsed time national record run
-
Life, liberty, and the pursuit of Pro Stock Motorcycle parity: What the numbers say
-
Where inches matter: This season, 26 rounds have been decided by milliseconds
-
Behind the Numbers: How does Austin Prock’s new crew chief shake up Countdown chase?
-
Behind the Numbers: Alan Johnson continues to pile up wins in NHRA
-
Behind the Numbers: Five Funny Car drivers who should move up the standings in 2019
-
Behind the Numbers: Ranking the 10 best Top Fuel seasons in the Countdown era
-
Hight vs. Todd, Gray chases first title and a wild finale to Pro Stock Motorcycle in Pomona
-
Behind the Numbers: Championship scenarios entering the NHRA Toyota Nationals

-
Behind the Numbers: Championship odds for the leaders in the clubhouse(s)
-
Behind the Numbers: How I learned to stop worrying and love reaction times
-
Behind the Numbers: Tim Wilkerson making championship bid
-
Behind the Numbers: Who boasts the best shot at making the Countdown to the Championship?
-
Behind the Numbers: Funny Car will tighten up down the stretch

-
Behind the Numbers: Clay Millican may finally have consistency he needs
-
Behind the Numbers: Hines and Krawiec identical through three races
-
Behind the Numbers: Consistency has Todd off to the races
-
Behind the Numbers: Vincent Nobile's return to the winner's circle
-
Behind the Numbers: Who's on top three races into the season?
-
Behind the Numbers: Breaking the No. 1 qualifier curse
-
Behind the Numbers: Rounding out our evaluation of drag racing performance
-
Behind the Numbers: Just how important is a great start?
-
Behind the Numbers: Kalitta has been great, now he just needs a little luck
-
Behind the Numbers: Picking the next first-time champs from Top Fuel to Pro Stock Motorcycle
-
Behind the Numbers: Counting down the 10 closest finals of 2017
-
Behind the Numbers: Silly season kicks off with new faces in new places
-
Behind the Numbers: Langdon prepares to make switch to Funny Car
-
Behind the Numbers: Stage is set for close finish to NHRA season
-
Behind the Numbers: McMillen reinforces age is only a number in NHRA Drag Racing
-
Behind the Numbers: How Krawiec can clinch a title in Las Vegas
Behind the Numbers: Who's on top three races into the season?
It’s time to take stock of things three races into the NHRA Drag Racing season. There have been 10 different winners following the Amalie Motor Oil NHRA Gatornationals as something close to parity reigns in the Mello Yello categories. If you know me, you know I’ll never look at the standings page to tell you who’s clicking and who’s not heading into any given race weekend — this season is no exception. So, let’s go through all four Pro classes to see what we’ve learned so far.
Note: All Top Fuel average elapsed times include runs quicker than 3.9 seconds, Funny Car average elapsed times include runs quicker than 4 seconds, Pro Stock average elapsed times include runs quicker than 6.7 seconds, Pro Stock Motorcycle average elapsed times include runs quicker than 7 seconds. *'s = red-light starts.
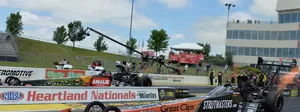
TOP FUEL
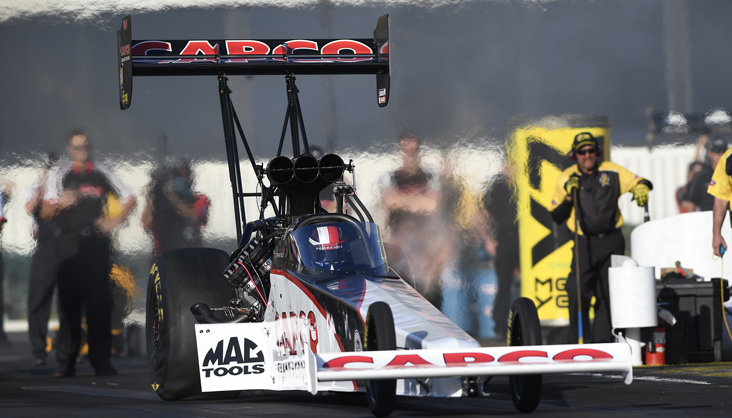
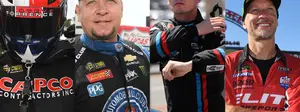
A wild ride in the first round of eliminations at the Gators notwithstanding, Steve Torrence remains the racer to beat in the dragster category. He boasts the quickest car (on average, 3.705 compared to 3.708 from Clay Millican, chill out) and gets down the track 57.9 percent of the time. There are racers more consistent but not nearly as quick as the “Capco kid.” Here are a couple of drivers worth keeping an eye on, though.
Tony Schumacher averages a 3.720 elapsed time on all runs and gets down the track at the same rate as Torrence. “The Sarge” doesn’t get down the track as often during eliminations as Torrence (57.1 compared to 71.4) but when he does, it’s quick (3.710 compared to 3.713). The sample size is small during eliminations, so give the U.S. Army time to turn things around on that front — they could just need a little good luck.
The Lucas Oil NHRA Winternationals presented by ProtectTheHarvest.com winner, Doug Kalitta, has been deadly consistent this season, but the Mac Tools driver hasn’t been that quick. Crew chief Jim Oberhofer gets Kalitta down the track 70.6 percent of the time on all passes and 66.7 percent of the time during eliminations, but his average e.t. is 3.774. Kalitta boasts the best reaction-time average in the class (.0607), but it would take a very sleepy light in the later rounds to turn those elapsed times into win lights.
The average overall elapsed time is 3.758, and the average elapsed time during eliminations is 3.768. The average reaction time is .0895. The top-five leavers in the class are Kalitta (.0607), Leah Pritchett (.0623), Antron Brown (.0636), Richie Crampton (.0658), and Schumacher (.0717).
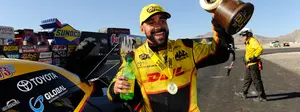
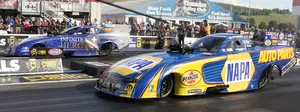
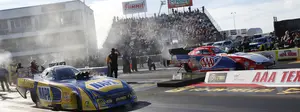
FUNNY CAR
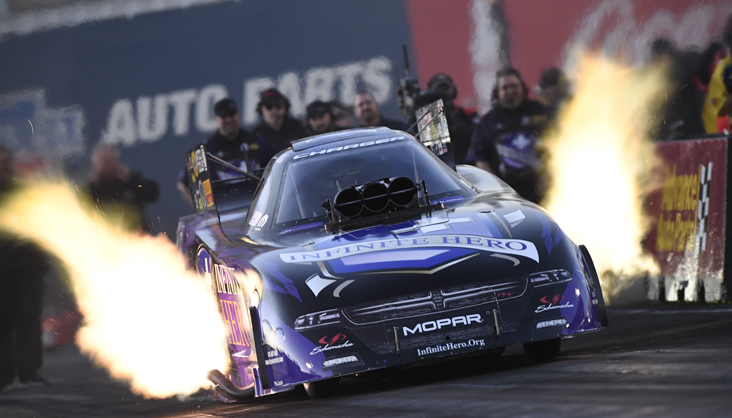
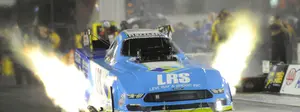
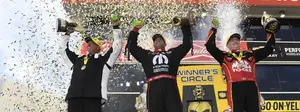
Things are tighter in the flopper category because the quickest cars aren’t the most consistent cars, but the separation between the two is not great. Here, I give the edge to consistency and Gainesville winner Jack Beckman. His elapsed time average is 3.906, and he gets down the track 66.7 percent of the time overall and during eliminations. That’s only .013-second slower than elapsed time leader Courtney Force, who is a little less consistent (42.1 success rate).
Behind Beckman is Gainesville runner-up and Pomona winner Matt Hagan, who has a slightly quicker car (3.904 average). Beckman gets the edge because of his consistency; Hagan and crew chief Dickie Venables get the Mopar Express Lane Dodge down the strip 54.5 percent of the time and 60 percent of the time during eliminations — that’s near the top of the heap in the class. There’s a reason Hagan is leading the Funny Car standings.
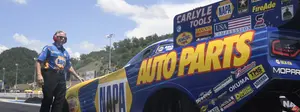
Robert Hight is just a thousandth slower than teammate Force, and his success rate overall hasn’t been much better (47.4 percent), but crew chief Jimmy Prock has gotten the Auto Club Chevy down the track at a great rate during eliminations (71.4). The small sample size at play could mean we’re looking at an anomaly here, but that’s something to keep an eye on as the season progresses.
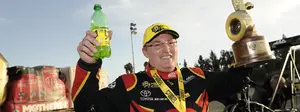
One more car to shout out is the DHL Toyota Camry of J.R. Todd. It hasn’t been particularly quick (3.957), but it has been very consistent (60 percent). If Todd’s Funny Car can be backed down with similar results, things might start to trend up for that team.
The average overall elapsed time is 3.923, and the average elapsed time during eliminations is 3.930. The average reaction time is .1008-second. The top-five leavers in the class are Cruz Pedregon (.0563), Todd (.0620), Hight (.0659), Hagan (.0695), and Beckman (.0703).
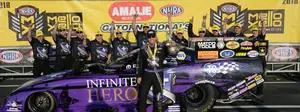
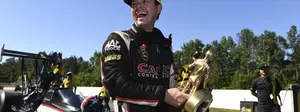
PRO STOCK
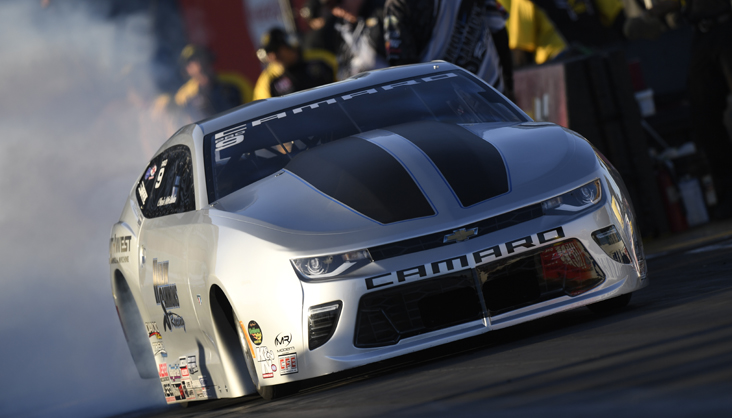
It won’t shock you to hear that the top of the table in Pro Stock is separated by a thin margin. It also won’t shock you to learn a KB Racing driver is among the leaders. It may be something of a surprise to hear I’m giving the edge to Chris McGaha for a couple of reasons. While he doesn’t lead based on elapsed time (6.562), he’s darn close to the inconsistent 6.557 that tops the charts. McGaha boasts one of the most consistent stockers in the class (94.4 percent, 100 percent during eliminations) and is one of the reaction-time leaders (.0249) — he deserves this.
But Greg Anderson is right there. He’s going to win a race very soon, perhaps as soon as the Denso Spark Plugs NHRA Four-Wide Nationals in Las Vegas. Anderson is just behind teammate Jason Line’s class-leading e.t. average with a 6.558 and gets down the track 94.4 percent of the time (83.3 percent during eliminations). His reaction time leaves something to be desired (.415), but he doesn’t red-light, and he’s getting another Wally before too long.
That is unless his teammate gets one first. I know what you’re thinking. Which one? This time, I mean Bo Butner. Here’s the weird thing about Butner this season: His car has been consistent (95.2 percent) but not all that quick (6.574) while Line’s car has been quick but not all that consistent (71.4 percent). Deric Kramer boasts the same e.t. average as Butner while his relative inconsistency can likely be attributed to getting a handle on a new hot rod. So, for now, this looks like the top three in Pro Stock. Of course, it looks like Tanner Gray is back in business after his win in Gainesville. If that’s the case, this all changes.
The average overall elapsed time is 6.583, and the average elapsed time during eliminations is 6.586. The average reaction time is .0467-second. The top-five leavers in the class are Gray (.0213), Jeg Coughlin Jr. (.0240), Kramer (.0240**), Erica Enders (.0246*), and McGaha (.0249).
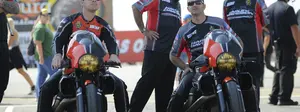
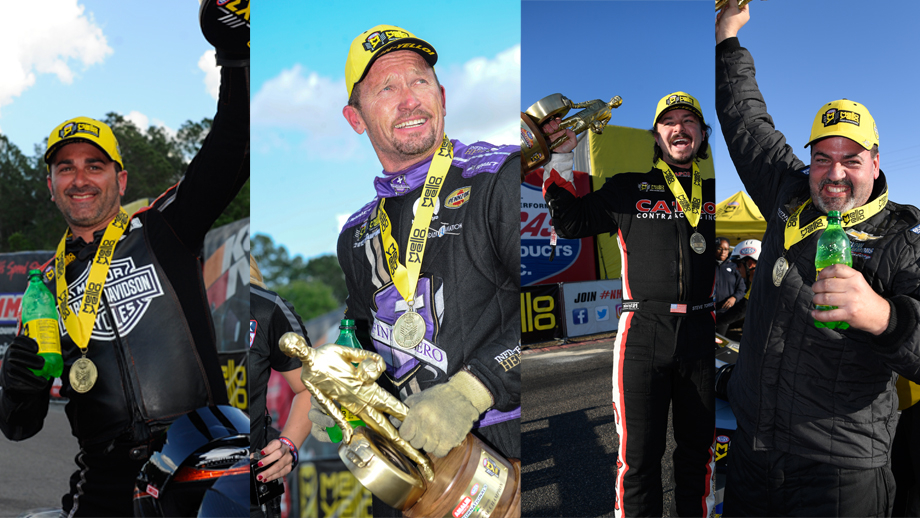
PRO STOCK MOTORCYCLE
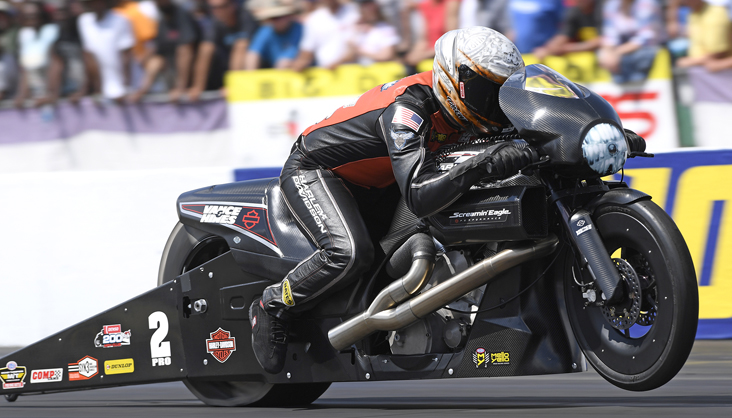
Let’s be honest: It’s too early for any real statistical analysis on this class, so I’m going to just give some very cursory observations based on the first race of the season. First, yes, the Harley-Davidson Street Rods did run as fantastic as you thought they did. They lead the class in average elapsed time and got down the strip 100 percent of the time. Andrew Hines leads the class with an average e.t. of 6.829 — the next closest average e.t. is 6.844.
That belongs to Joey Gladstone, who had one heck of a weekend until he lost in the first round when his bike slowed considerably. We’ll call that an anomaly for now because it looks like Gladstone is really onto something here. The rider was the best leaver in the class a season ago, and if he’s got a bike that quick this season, he’s going to win multiple races this season. That’s exciting.
The next quickest rider? Scotty Pollacheck. He wasn’t as consistent as Jerry Savoie, but damn, it’s fun to think about Gladstone and Pollacheck having bikes that quick all season. Let’s get that final round booked, OK?
The average overall elapsed time for the first weekend of racing was 6.892 seconds, and the average elapsed time during eliminations was 6.899. The average reaction time was .0544-second.