


-
Behind the numbers of Greg Anderson's Pro Stock elapsed time national record run
-
Life, liberty, and the pursuit of Pro Stock Motorcycle parity: What the numbers say
-
Where inches matter: This season, 26 rounds have been decided by milliseconds
-
Behind the Numbers: How does Austin Prock’s new crew chief shake up Countdown chase?
-
Behind the Numbers: Alan Johnson continues to pile up wins in NHRA
-
Behind the Numbers: Five Funny Car drivers who should move up the standings in 2019
-
Behind the Numbers: Ranking the 10 best Top Fuel seasons in the Countdown era
-
Hight vs. Todd, Gray chases first title and a wild finale to Pro Stock Motorcycle in Pomona
-
Behind the Numbers: Championship scenarios entering the NHRA Toyota Nationals

-
Behind the Numbers: Championship odds for the leaders in the clubhouse(s)
-
Behind the Numbers: How I learned to stop worrying and love reaction times
-
Behind the Numbers: Tim Wilkerson making championship bid
-
Behind the Numbers: Who boasts the best shot at making the Countdown to the Championship?

-
Behind the Numbers: Funny Car will tighten up down the stretch

-
Behind the Numbers: Clay Millican may finally have consistency he needs
-
Behind the Numbers: Hines and Krawiec identical through three races
-
Behind the Numbers: Consistency has Todd off to the races
-
Behind the Numbers: Vincent Nobile's return to the winner's circle
-
Behind the Numbers: Who's on top three races into the season?
-
Behind the Numbers: Breaking the No. 1 qualifier curse
-
Behind the Numbers: Rounding out our evaluation of drag racing performance

-
Behind the Numbers: Just how important is a great start?
-
Behind the Numbers: Kalitta has been great, now he just needs a little luck
-
Behind the Numbers: Picking the next first-time champs from Top Fuel to Pro Stock Motorcycle
-
Behind the Numbers: Counting down the 10 closest finals of 2017
-
Behind the Numbers: Silly season kicks off with new faces in new places

-
Behind the Numbers: Langdon prepares to make switch to Funny Car
-
Behind the Numbers: Stage is set for close finish to NHRA season
-
Behind the Numbers: McMillen reinforces age is only a number in NHRA Drag Racing
-
Behind the Numbers: How Krawiec can clinch a title in Las Vegas
Behind the Numbers: Ranking the 10 best Top Fuel seasons in the Countdown era
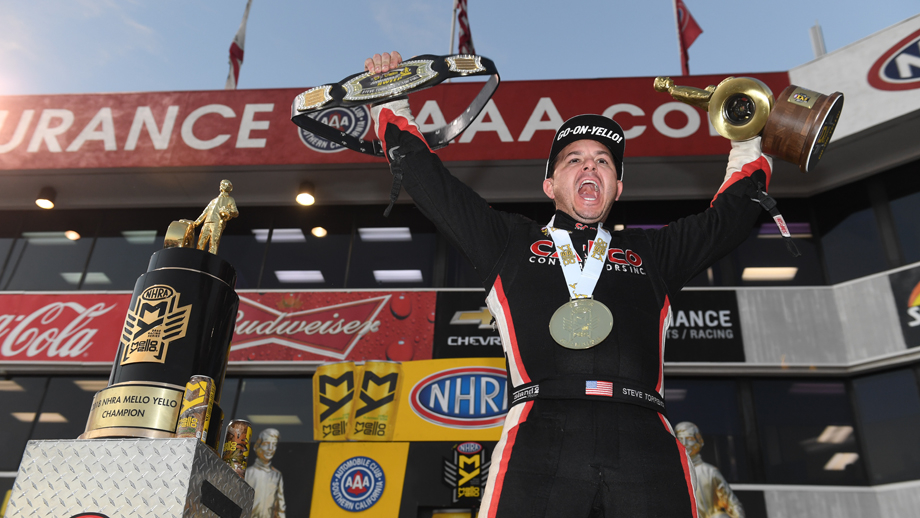
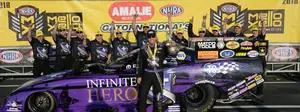
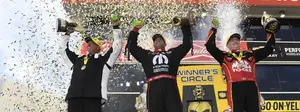
Steve Torrence swept the 2018 Countdown to the Championship en route to his first Top Fuel title. He became the first to win all six playoff races, which, in addition to sports media's affinity for recency bias, led to some predictable hyperbole.
That doesn’t make comparing single-season performances easy. At least, not if done in a sensible way. Stacking #winz, consecutive or not, up against one another is problematic at best, as is comparing point totals (even if done relative to the rest of the field).
So, I decided to take the first part of the offseason to dive into the numbers to see where Torrence’s great 2018 campaign stacks up against other magnificent Top Fuel seasons in the 1,000-foot era. First, I needed to come up with a way to assign a number to every season (here comes math, I’m sorry).
The stat, which I’ve labeled win points (WP for short) accounts for average elapsed time (minus the class average), average reaction time, and success rate (how often the car gets down the track). The formula is: (average elapsed time – class average elapsed time) – (success rate/10) + average reaction time. A lower number is better and the result, for a good season, anyway, will result in a negative number. So, the more negative … the better. I’m sorry.
Using the class average e.t. subtracted from the racer’s average e.t. makes the number comparable from year to year. The class average e.t. includes the top 60 percent of runs from that year and is based on both qualifying and elimination runs from 2016-2018. For years before that, I use only elimination runs based on data availability; there is not a major difference in average e.t. between qualifying and eliminations, so I prefer to use both when possible because it gives us more data.
So, since most of you skipped all that noise to get to the list, let’s get on with it. I included every season champion on my list and every driver with a score of -0.020 and lower. The average score of a champion is -0.033, which is just -.002 higher than the overall list average. There are 30 total racers on the list and 11 champions. It’s fair to say any racer within .001 or .002 points of another is negligible and up for debate — which will become important as we get further up the list.
To make things a little easier on the eyes, you can see this whole list sorted by WP from 1-10 at the bottom of the article.
10. Steve Torrence — 2016
Finish: Second
Average E.T.: 3.767
Class Average E.T.: 3.789
Average R.T.: .0728
Success Rate: 84.7%
WP: -.034
We talk a lot about Torrence’s missed-it-by-that-much 2017 campaign, but the Texan also put together an incredible 2016 season that deserves nearly as much acclaim. The difference in 2016? His good buddy Antron Brown raced even better.
9. Tony Schumacher — 2008
Finish: First
Average E.T.: 3.884
Class Average E.T.: 3.904
Average R.T.: .0718
Success Rate: 86.4
WP: -.035
First: Only races following Englishtown were used to calculate these stats (so, 1,000-foot races only). Second: This is the gold standard for those who want to use the #winz argument over everything else, but frankly Schumacher had a great year against so-so competition, which makes some of those wins a little hollow when stacking them up against others on this list.
8. Antron Brown — 2016
Finish: First
Average E.T.: 3.776
Class Average E.T.: 3.789
Average R.T.: .0544
Success Rate: 80%
WP: -.039
Brown won his second straight championship with a very quick, very consistent race car — but the obvious eye-popper here is his reaction-time average. The next closest to Brown in reaction-time average was Shawn Langdon, who averaged a .0569 light.
7. Tony Schumacher — 2012
Finish: Second
Average E.T.: 3.809
Class Average E.T.: 3.829
Average R.T.: .0616
Success Rate: 80.4%
WP: -.039
Schumacher let this season get away from him in a big way. He finished behind teammate Brown by only seven points and had the better average e.t. and success rate (the latter by a wide margin). We’ll call it a fair trade, though — Brown won with the lowest WP of any champ in the Countdown era (-.019) … except for the previous year, when Schumacher won the a -.011.
6. Larry Dixon — 2010
Finish: First
Average E.T.: 3.861
Class Average E.T.: 3.895
Average R.T.: .0772
Success Rate: 84.3%
WP: -.041
Dixon’s Top Fueler was a full hundredth quicker than the next quickest car (Schumacher at 3.874), and it was the only dragster to get down the track more than 80 percent of the time. That made Dixon the champion, and it also easily puts him in the top 10 on our list.
5. Spencer Massey — 2011
Finish: Second
Average E.T.: 3.866
Class Average E.T.: 3.885
Average R.T.: .0566
Success Rate: 78.2%
WP: -.041
This is in the hall of fame of second-place finishes. The wheels came off Massey’s season during the Countdown, as the racer failed to qualify in Dallas and ended up 58 points behind Del Worsham when the season wrapped up.
4. Antron Brown – 2017
Finish: Fourth
Average E.T.: 3.749
Class Average E.T.: 3.78
Average R.T.: .0601
Success Rate: 73%
WP: -.044
No, Brown is not the first person you think of when I mention Top Fuel racers who had great 2017 seasons but did not win the championship — and I’m not saying he should be, either. But man did the Matco Tools team have a ton of bad luck prior to the departure of Brian Corradi. Want to make an argument for his value? Brown’s WP made a .029 change from season to season. Yikes.
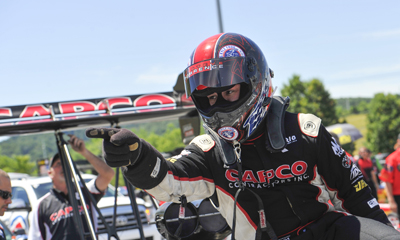
3. Steve Torrence – 2017
Finish: Second
Average E.T.: 3.753
Class Average E.T.: 3.78
Average R.T.: .0606
Success Rate: 80.2%
WP: -.047
So, we have arrived at the Torrence block of the tour. Great reaction times, an incredible dragster in terms of speed and consistency. Yep, it’s all here — but a bit of bad luck and failure to perform during the playoffs cost the Capco Contractors team its first championship down the stretch. That doesn’t take away from what was by far one of the best seasons of all time.
2. Steve Torrence — 2018
Finish: First
Average E.T.: 3.781
Class Average E.T.: 3.825
Average R.T.: .0709
Success Rate: 75.2%
WP: -.049
What’s most impressive about Torrence’s championship season is how well crew chiefs Richard Hogan and Bobby Lagana responded to the track prep changes. The average e.t. dropped less than three hundredths of a second while the class average e.t. went down more than four hundredths. Torrence was competitive on the Tree (nearly a hundredth above the class average) and the dragster was silky smooth down the track.
1. Antron Brown – 2015
Finish: First
Average E.T.: 3.777
Class Average E.T.: 3.798
Average R.T.: .054
Success Rate: 82.6%
WP: -.050
It’s a coin flip between this season and the one put together by Torrence in 2018, but damn Brown killed it en route to his second title. Not only was he quicker than everyone down the track, he smashed the Tree (again) and his dragster made it down nearly every single time he hit the gas. There’s a great debate on top of this list, but man is it hard to argue against what Brown did to lock up his second title against one of the best fields in modern Top Fuel racing: Tony Schumacher, Shawn Langdon, J.R. Todd, Doug Kalitta, Spencer Massey, Richie Crampton, Larry Dixon, and Steve Torrence.