


-
Behind the numbers of Greg Anderson's Pro Stock elapsed time national record run
-
Life, liberty, and the pursuit of Pro Stock Motorcycle parity: What the numbers say
-
Where inches matter: This season, 26 rounds have been decided by milliseconds
-
Behind the Numbers: How does Austin Prock’s new crew chief shake up Countdown chase?
-
Behind the Numbers: Alan Johnson continues to pile up wins in NHRA
-
Behind the Numbers: Five Funny Car drivers who should move up the standings in 2019

-
Behind the Numbers: Ranking the 10 best Top Fuel seasons in the Countdown era
-
Hight vs. Todd, Gray chases first title and a wild finale to Pro Stock Motorcycle in Pomona
-
Behind the Numbers: Championship scenarios entering the NHRA Toyota Nationals

-
Behind the Numbers: Championship odds for the leaders in the clubhouse(s)
-
Behind the Numbers: How I learned to stop worrying and love reaction times
-
Behind the Numbers: Tim Wilkerson making championship bid
-
Behind the Numbers: Who boasts the best shot at making the Countdown to the Championship?

-
Behind the Numbers: Funny Car will tighten up down the stretch

-
Behind the Numbers: Clay Millican may finally have consistency he needs
-
Behind the Numbers: Hines and Krawiec identical through three races

-
Behind the Numbers: Consistency has Todd off to the races
-
Behind the Numbers: Vincent Nobile's return to the winner's circle
-
Behind the Numbers: Who's on top three races into the season?
-
Behind the Numbers: Breaking the No. 1 qualifier curse
-
Behind the Numbers: Rounding out our evaluation of drag racing performance
-
Behind the Numbers: Just how important is a great start?
-
Behind the Numbers: Kalitta has been great, now he just needs a little luck
-
Behind the Numbers: Picking the next first-time champs from Top Fuel to Pro Stock Motorcycle
-
Behind the Numbers: Counting down the 10 closest finals of 2017
-
Behind the Numbers: Silly season kicks off with new faces in new places

-
Behind the Numbers: Langdon prepares to make switch to Funny Car
-
Behind the Numbers: Stage is set for close finish to NHRA season
-
Behind the Numbers: McMillen reinforces age is only a number in NHRA Drag Racing
-
Behind the Numbers: How Krawiec can clinch a title in Las Vegas
Behind the Numbers: Rounding out our evaluation of drag racing performance
Getting from the starting line to the finish line quickly is essentially the stated goal of a drag race. Yes, doing so more quickly than the person in the other lane(s) is a major part of the equation, but you can (probably) only control your own vehicle. So, any statistical analysis of the quality of a drag racing team should look at both how quickly the car/bike gets down the lane and how often it gets down said boulevard.
That’s where success percentage comes in. The idea is to create a percentage that shows how often a racer gets to the finish line within a certain amount of time. The subjective portion of this percentage is that “certain amount of time.” I’ve come up with solid numbers for each of the four Professional categories, but these are still open for debate; after all, what’s a good sports statistic without a little healthy debate?
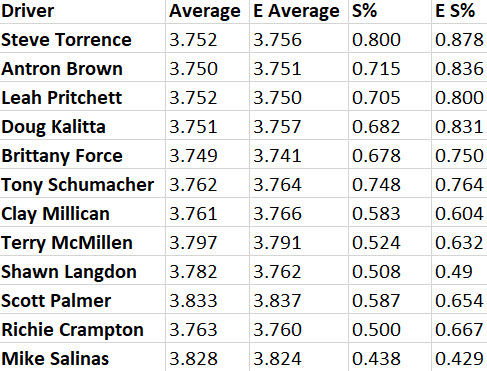 In Top Fuel, anything quicker than 3.9 seconds gets you a passing grade. So, here’s how the formula works: All runs quicker than 3.9 seconds are divided by that racer’s total number of runs to calculate their success percentage. The number you’re really looking for, of course, is the eliminations success percentage (ESP, for short). That’s just as easily calculated by only looking at eliminations runs.
The chart on the right (and every other chart in this post) shows all the driver’s available stats starting in 2016 and running through the 2018 NHRA Arizona Nationals.
By looking at this percentage in conjunction with the average elapsed time of all runs quicker than 3.9 seconds, you can start to get an idea of who has the best car. You can take that a step further by looking at reaction times; that takes you from the best setup to who has the best overall chance of winning on race day. Before we move on, and look at some numbers from the 2017 season, here are the cutoffs I came up with for the other three Professional classes.
Funny Car (4 seconds)
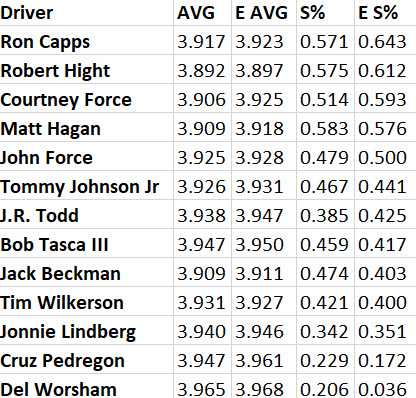 In a previous piece (this one, in fact), I referenced both a 4-second and 4.5-second cutoff. This is the tough, human part of the equation (and I imagine it will cause more debate than any of the other cutoffs) because some Funny Cars run slower than 3.999 seconds. I chose to use 4 seconds because that’s what it takes to win races. Here are the numbers to back that up.
Of the 704 Funny Car eliminations runs made in 2017, 299 were made quicker than 4 seconds. Of those 299, 224 resulted in the car moving to the next round (via a win or a runner-up in the NHRA Four-Wide Nationals). That’s a 74.9 “winning percentage.” If you bump the cutoff to 4.5 seconds, the winning percentage drops to 64.2 percent. As cars get quicker from top to bottom, it’s imperative to try to capture a representative average. That means taking an average elapsed time of successful runs – in Funny Car, those are runs that come quicker than 4 seconds.
Pro Stock (6.7 seconds)
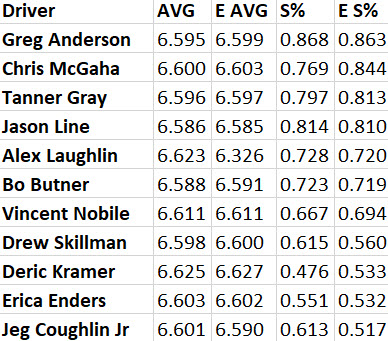 I started by using the same number for both Pro Stock and Pro Stock Motorcycle, which may seem odd at first, but when digging into the numbers, I discovered how fungible this cutoff could be. Most Pro Stock and Pro Stock Motorcycle runs end successfully because the tuners are so damn good at their jobs, and unlike their nitro counterparts, there isn’t much “pedaling” when things go awry. You either get down the track in the 6-second range, or you don’t get down at all.
Still, getting a little deeper revealed the number I used for average elapsed times back in our Year in Review issue (that’s 25 of Volume 58 of National Dragster, or just the last issue of 2017 if you prefer) is the way to go. Unless we’re running in Denver, or it’s 100 percent humidity, this is about what it takes to win a race in the naturally aspirated category. The name at the top of the list will make sense to you if you’ve been paying attention: Greg Anderson.
It also highlights some racers who probably don’t get enough credit for how consistently they get down the track (Chris McGaha), and points out why Elite Motorsports struggled so much last season. Again, this is just one number that needs to be looked at in conjunction with elapsed and reaction times, but it’s a good place to start when thinking about how good a racer is on elimination days.
Pro Stock Motorcycle (7 seconds)
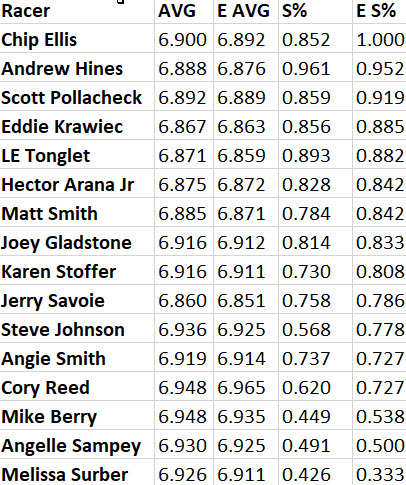 The cutoff for Pro Stock Motorcycle was simple (and everyone loves a round number), plus it gives us names near the top of the list that everyone can live with. Chip Ellis, in a small sample size on two different bikes, and then Andrew Hines. Follow that up with another deadly consistent rider in Scotty Pollacheck, who made huge strides in 2017.
We then get to our two biggest contenders for the 2017 championship: Eddie Krawiec and LE Tonglet. The two got to the top with consistent passes and quick times. You’re probably starting to sense a pattern, so I won’t repeat myself here. All sports are looking for a catch-all, one-size-fits-all statistic, and the truth is that finding one is exceptionally difficult (and let’s be honest, above my pay grade). The smart money is on looking at a few different numbers and making an informed judgment. This is just another to add to the pot.
Anything can happen in the Countdown to the Championship, and certainly anything can happen on eliminations day, but when looking over the scope of a whole season, this is the start of a good blueprint.