


-
Behind the numbers of Greg Anderson's Pro Stock elapsed time national record run
-
Life, liberty, and the pursuit of Pro Stock Motorcycle parity: What the numbers say
-
Where inches matter: This season, 26 rounds have been decided by milliseconds
-
Behind the Numbers: How does Austin Prock’s new crew chief shake up Countdown chase?

-
Behind the Numbers: Alan Johnson continues to pile up wins in NHRA

-
Behind the Numbers: Five Funny Car drivers who should move up the standings in 2019

-
Behind the Numbers: Ranking the 10 best Top Fuel seasons in the Countdown era
-
Hight vs. Todd, Gray chases first title and a wild finale to Pro Stock Motorcycle in Pomona

-
Behind the Numbers: Championship scenarios entering the NHRA Toyota Nationals

-
Behind the Numbers: Championship odds for the leaders in the clubhouse(s)

-
Behind the Numbers: How I learned to stop worrying and love reaction times
-
Behind the Numbers: Tim Wilkerson making championship bid
-
Behind the Numbers: Who boasts the best shot at making the Countdown to the Championship?

-
Behind the Numbers: Funny Car will tighten up down the stretch

-
Behind the Numbers: Clay Millican may finally have consistency he needs

-
Behind the Numbers: Hines and Krawiec identical through three races

-
Behind the Numbers: Consistency has Todd off to the races
-
Behind the Numbers: Vincent Nobile's return to the winner's circle
-
Behind the Numbers: Who's on top three races into the season?

-
Behind the Numbers: Breaking the No. 1 qualifier curse

-
Behind the Numbers: Rounding out our evaluation of drag racing performance
-
Behind the Numbers: Just how important is a great start?

-
Behind the Numbers: Kalitta has been great, now he just needs a little luck
-
Behind the Numbers: Picking the next first-time champs from Top Fuel to Pro Stock Motorcycle
-
Behind the Numbers: Counting down the 10 closest finals of 2017
-
Behind the Numbers: Silly season kicks off with new faces in new places

-
Behind the Numbers: Langdon prepares to make switch to Funny Car
-
Behind the Numbers: Stage is set for close finish to NHRA season
-
Behind the Numbers: McMillen reinforces age is only a number in NHRA Drag Racing
-
Behind the Numbers: How Krawiec can clinch a title in Las Vegas
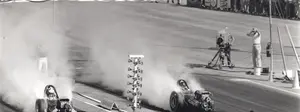
Behind the Numbers: How I learned to stop worrying and love reaction times
Before I knew the phrase “reaction time,” I knew what it meant. At least, I thought I knew what it meant. Pulling up alongside some yuppy playing his music too loudly at a red-light, making incidental eye contact and … hang on, I’m getting a note from legal. Right, calmly making a legal right turn and going about your day.
Listen, I get it. Reaction times as we know them in NHRA Drag Racing can be cumbersome and complicated — but we also make them too complicated because we want them to be something they’re not. The timer does not measure green light to foot-crushing-pedal — that’s a limitation of the technology currently employed. So, that means we all can make the best of the numbers spat onto our computer screens.
Let’s start where the buzz gets killed: deep staging. I’d have retired by now if I had a dollar … make that $50 for every email, tweet, or smug racer who complained about reaction-time averages that didn’t account for a racer’s position when the bulbs dropped. I get it. It’s apples to oranges that got a head start. Here’s something to chew on: I’ve never gotten a similar email about my elapsed time averages, which are similarly influenced by where a racer stages. I’m not saying deep staging doesn’t matter, but everything matters, right?
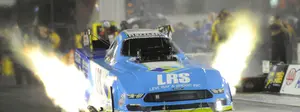
Except it doesn’t. What’s crystal clear is that what matters is the ego stat, which is why people get bent out of shape about deep staging, because it — allegedly — boosts reaction-time average. Except when it doesn’t. John Force is a famous deep stager and was top three in reaction-time average in 2017. This season? He’s only slightly above average in reaction-time average. J.R. Todd is outspoken about lining up evenly on race day, and he’s currently third only to Cruz Pedregon and Robert Hight in reaction-time average.
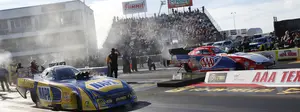
Funny Car is the most finicky, or at least the category that draws the most ire, because of deep staging — which again, is legal, fun-haters. The average is .079, and Pedregon leads with a .067. He’s followed by Hight (.07), Todd (.07), Matt Hagan (.07), and Jack Beckman (.072). That’s how thin the margin is at the top of the field, and, except for Pedregon, each of those racers has at least 40 leaves this season. Perhaps most impressively, none of those racers have more than one red-light — Todd has yet to foul this year with 42 leaves.
Those are the only three reaction-time stats you’ll see me regularly mention, in part because they’re easy to digest. More importantly, all the other reaction-time stats don’t tell you much about the driver they’re attributed to: Holeshots depends on the driver you’re racing (a .125 light can lead to a holeshot win, a .002 light can lead to a holeshot loss) and don’t get me started on how ridiculous the “left first” statistic is. At the end of the season, the best leavers in the class will be those who average a great light and don’t foul too often.
Caveats come into play, like with any statistic: Pedregon deep stages and has a smaller sample size to work with (27 leaves), but he’s also consistently very good. He’s the seventh-best leaver in the Funny Car category over the past three seasons with a .073 reaction time and three red-lights; that’s nothing to sneeze at. When I calculate reaction times, I throw out lights slower than .200 for a couple of reasons.
The first, and most important reason, is to get rid of junk data that the computer spits out. When I first started collecting data, I picked out runs where something went wrong in the other lane and caused the driver to cut a bad light. In almost every circumstance, these lights were slower than .200. To speed up the process, I chose to throw out all the .200 lights, knowing a big enough sample would take care of the data eventually.
That’s what got me to these reaction times in all four Professional categories through 20 races this season. Complain if you want, but I’m not stressing it.
TOP FUEL REACTION-TIME AVERAGE: .079
FUNNY CAR REACTION-TIME AVERAGE: .079
PRO STOCK REACTION-TIME AVERAGE: .035
PRO STOCK MOTORCYCLE REACTION-TIME AVERAGE: .041