


-
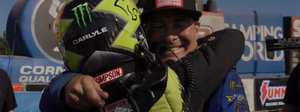
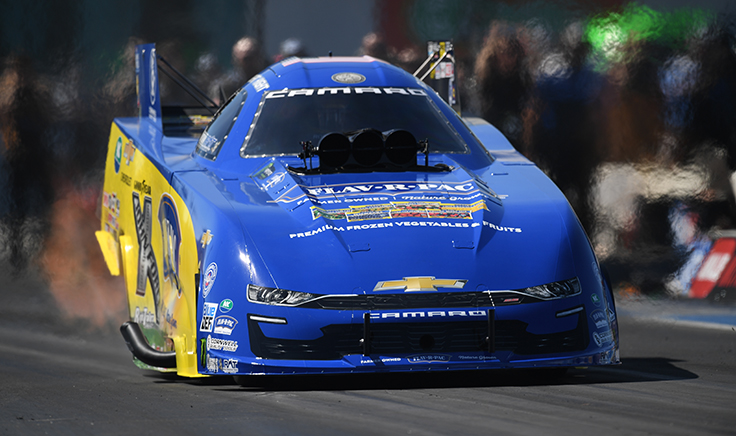
Cruz Pedregon chasing first Sonoma Funny Car win in nearly 30 years
-
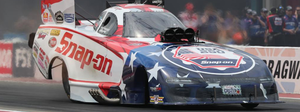
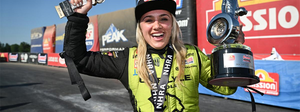
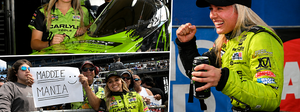
Top Fuel’s most recent winner Maddi Gordon riding high heading to Sonoma
-
Exploring a new stat where semifinals or better are the new eliminations goal
-
Maddi Gordon: The interview
-
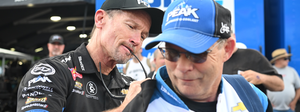
Antron Brown on seeing opportunity when the temperature rises
-
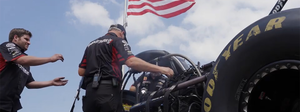
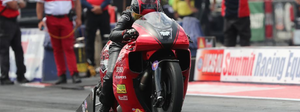
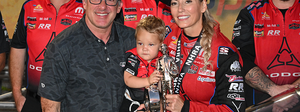
Behind the Scenes with the winners of the Summit Racing Equipment NHRA Nationals
-
Midseason review: Battles still raging for regular-season championships
-
Weekend Rewind 2026 Summit Racing Equipment NHRA Nationals
-
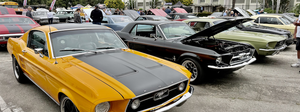
Nearly 150 vehicles fill Wally Parks NHRA Motorsports Museum for June Cars & Coffee
-
Matt Latino chasing first Pro Stock victory while building a winning formula on and off the track
-
As a new team owner, Massey is no longer Spencer for hire
-
Focused and determined, Evaristo has discovered newfound fun in 2026 season
-
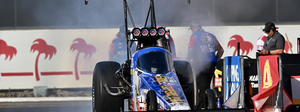
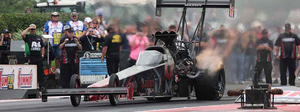
Top Fuel’s Clay Millican hoping good vibes in Norwalk lead to win
-
Plenty on the line for Hyde at Summit Racing Equipment NHRA Nationals
-
A slightly different role with the same result as Pruett delivered again with a win
-
What if we told you NHRA's first vice president dominated Pikes Peak in the '60s
-
Bristol winners Hagan, Hartford, Herrera join WFO's NHRA Nitro podcast

-
Behind the Scenes with the winners of the Super Grip NHRA Thunder Valley Nationals
-
Weekend Rewind: 2026 Super Grip NHRA Thunder Valley Nationals
-
Five things we learned at the Super Grip NHRA Thunder Valley Nationals
-
Sunday Photo Gallery: Super Grip NHRA Thunder Valley Nationals comes alive
-
Flexjet NHRA Factory Stock Showdown's Raymond Nash is chasing a family dream
-
Austin Prock says toughest season may create strongest version of himself
-
Saturday Photo Gallery: Super Grip NHRA Thunder Valley Nationals comes alive
-
Friday Photo Gallery: In the eye of the storm at Super Grip NHRA Thunder Valley Nationals
-
Jordan Vandergriff embraces unique Bristol opportunity this weekend
-
Richard Gadson, Greg Anderson return to Bristol after milestone moments a year ago
-
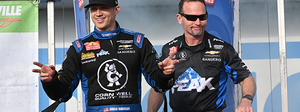
Teammates Jack Beckman and Jordan Vandergriff looking for big Bristol weekend
-
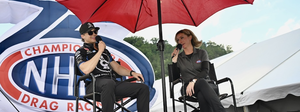
Dallas Glenn, Angie Smith join WFO Radio to preview upcoming Bristol event

-
Five things we learned at the NHRA New England Nationals presented by bproauto
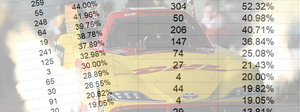
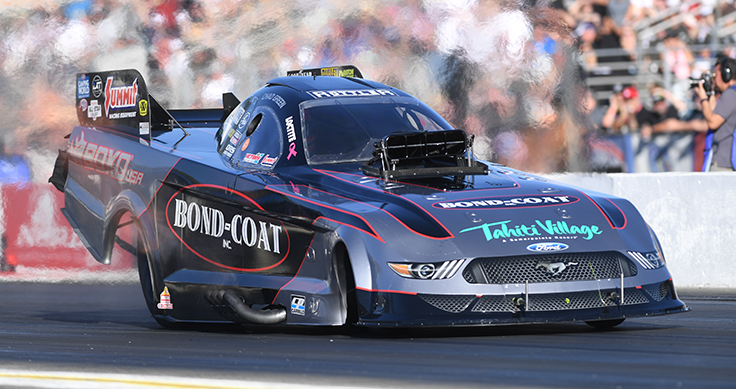
Benchmarking 2024: How to crack the Funny Car championship code (on paper)
A short while ago, we looked at the performance metrics of the Top Fuel class over the last couple of seasons and what might be necessary (on a purely academic basis) to compete for a championship in 2024. Today, we’re going to perform the same exercise for the Funny Car category, and it will show us some interesting differences.
As tight as the top cars are in Top Fuel, it can be argued and displayed that Funny Car is even tighter up top, and that gap narrowed even further in 2023 from the 2022 season.
Of course, there are things we cannot account for, even when looking at performance trends. The addition of the Dave Richards’ Versatran team as a full-time player in 2024 is one of them, and secondly, the assumption of Robert Hight’s seat by talented Top Fuel chauffeur Austin Prock is another. That said, the numbers can tell us a lot. As an old boss used to say to us, “Past performance is an indicator of future success.” Let’s dive in.
Qualifying

When looking at the qualifying information from 2022 and 2023, there are some interesting changes but some even more interesting constants. For instance, let’s look at qualifying position. In 2022, Hight had the best average qualifying position at 2.73. In 2023, Bob Tasca III took that spot, averaging a 3.57. Hight was No. 2, averaging a 3.62 qualifying position.
The fact that the best average qualifying spot dropped by basically a whole position is no great surprise. Why? Tasca’s entry into the territory occupied by the “Big Three” of Matt Hagan, Ron Capps, and Hight over the course of 2023 bumped most everyone back a notch when it came to the top of the qualifying food chain. Like Top Fuel, Funny Car had more sessions, which also makes landing a No. 1 spot harder, given good cars having more data and opportunity on the track.
The constants are the interesting thing. John Force landed fifth in the order of average qualifying position in both 2022 and 2023. His average spot in 2022 was 5.91 and 2023 was 6.57. J.R. Todd was 10th both years with a 7.95 average in 2022 and 8.10 in 2023.
What’s most interesting about the Funny Car qualifying information over the last two seasons is twofold: The average elapsed time leaders in qualifying slowed down! In 2022, Hight led the field with an average qualifying elapsed time of 3.890, but in 2023, it was Hagan who averaged a class-best 3.926 but only had one No. 1 qualifier and was fourth in position average. How is that possible? A more conservative-appearing approach had the car getting to the finish line more often in qualifying, but they did not hit as many “hero run” dingers over the course of the season as some other teams. For what they lacked in huge numbers Friday and Saturday, they made up for with a championship to close the year.
To wrap up qualifying, in 2022, Hagan, Hight, and Capps all had six No. 1s. In 2023, Tasca and Hight each had seven, with Capps in the distance with two.
The Performance Benchmarks
Reaction time: If there is one topic that’s sure to get the world’s Funny Car driving contingent fired up over, it is the starting line, so let’s start there. As we look at the performance benchmarks of the last two years, it really bears starting on the human ones before we go into the mechanical end of things.
The class was remarkably consistent over the last two years when it came to reaction-time leaders. As the driver’s eyes roll into the backs of their heads, it should be mentioned that, yes, the depth of staging has a direct correlation on these numbers as it does on the 60-foot time and, ultimately, the elapsed time at the end of the course. All that said, check this out.
In 2022, Capps had the lowest average reaction time with a season average of .066. For the 2023 season, Chad Green was lowest with a .065 average. In both 2022 and 2023, Tasca was third with a .075 and .071 average per season, respectively. It’s No. 2 who stands out here, though.
That was Todd, who was .067 and .066 in 2022 and 2023, respectively. The lack of deviation in both his position in second and the one-thousandth spread season to season is remarkable for one important reason: He never alters how he stages, and if he does, it is rarely and in a subtle fashion. Because of where he has been for two seasons straight and the solid nature of the numbers, he’s the standard in the class, according to the numbers.
Elapsed time: In 2022, the quickest car by average on Sunday belonged to Alexis DeJoria with a 4.266 average eliminations elapsed time. In 2023, the frontrunner was Hagan with a significantly quicker 4.123. Undoubtedly, this is due to the nail-biting race to the finish in which nearly a half dozen cars entered the Finals with a chance at the big prize. The squeeze was on down the stretch and they pushed. Hight was second with a 4.166 average. This was quicker by a near-identical margin to Hagan’s second-best average in 2022 of 4.281.
The most telling numbers from 2022 into 2023 that portend what’s to come in 2024 are the round-win statistics. In 2022, Hight won 72 rounds, followed by Capps with 63, and finally Hagan with 60 round-wins. The top three accounted for 195 round-wins that season. In one of the most intense title chases ever, the numbers shrunk drastically in 2023. Hagan had the most with 56 round-wins, Capps was right behind him with 54, and Hight in third for this statistic with 51. That’s only 161 round-wins. So, what causes a near 20% drop? Competition.
There’s a better-than-average chance that if we keep on the path we have been following, the champion will win even fewer rounds this year because of how the rising tide of Funny Car has spread those round-wins among more and more “good cars” that are competing on a weekly basis. The old adage of there being “no easy ones” is actually borne out in the numbers here.
Don’t mistake a shrink in round-wins among the top three cars as a failure; accept it for what it is: an indication of more even competition from top to bottom. That's not ideal for drivers and crews, but ideal for fans as this number continues getting smaller. If it does, that means more wins for more people and more diversified success in the class.
Speed: Finally, we peek in at the Speed Index, a look at how often teams are making full-throttle trips to the finish line as measured against their total number of elimination runs.
In 2022, it was Tasca, Capps, and Hight with respective 81.8%, 81.1%, and 78% full-throttle completion rates. In 2023, Green led all comers at 79.1%, Hight was second at 76.7%, and Hagan was third at 76.6%. Until you reflect on what we have already discussed above. They had FEWER cracks at the track because they had fewer round appearances, so each pedaling or tire-smoking run had a negative effect on their average. We believe that these numbers are great benchmarks for what teams will be looking to achieve (for base percentages) in their own minds.
So, what does this pseudo Magic 8 Ball tell us about the performance numbers of a potential 2024 champion? Let’s take a crack at it:
- Qualify with an average e.t. of 3.90 and land an average qualifying spot between 2.5 and 4.4
- Score a minimum of 90 qualifying points over the course of the season
- Maintain an average reaction time (by any means necessary) of between .066-.072
- Complete a minimum of 80% of your runs under full-throttle acceleration
- Average between 4.15-4.25 as a season-long eliminations elapsed time
- Win between 47-52 rounds
If you think this is intimidating, wait until you see Pro Stock!