


-
Cruz Pedregon chasing first Sonoma Funny Car win in nearly 30 years
-
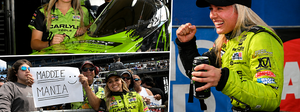
Top Fuel’s most recent winner Maddi Gordon riding high heading to Sonoma
-
Exploring a new stat where semifinals or better are the new eliminations goal
-
Maddi Gordon: The interview
-
Antron Brown on seeing opportunity when the temperature rises
-
Behind the Scenes with the winners of the Summit Racing Equipment NHRA Nationals
-
Midseason review: Battles still raging for regular-season championships
-
Weekend Rewind 2026 Summit Racing Equipment NHRA Nationals
-
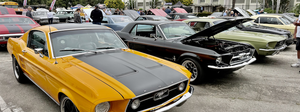
Nearly 150 vehicles fill Wally Parks NHRA Motorsports Museum for June Cars & Coffee
-
Matt Latino chasing first Pro Stock victory while building a winning formula on and off the track
-
As a new team owner, Massey is no longer Spencer for hire
-
Focused and determined, Evaristo has discovered newfound fun in 2026 season
-
Top Fuel’s Clay Millican hoping good vibes in Norwalk lead to win
-
Plenty on the line for Hyde at Summit Racing Equipment NHRA Nationals
-
A slightly different role with the same result as Pruett delivered again with a win
-
What if we told you NHRA's first vice president dominated Pikes Peak in the '60s
-
Bristol winners Hagan, Hartford, Herrera join WFO's NHRA Nitro podcast

-
Behind the Scenes with the winners of the Super Grip NHRA Thunder Valley Nationals
-
Weekend Rewind: 2026 Super Grip NHRA Thunder Valley Nationals
-
Five things we learned at the Super Grip NHRA Thunder Valley Nationals
-
Sunday Photo Gallery: Super Grip NHRA Thunder Valley Nationals comes alive
-
Flexjet NHRA Factory Stock Showdown's Raymond Nash is chasing a family dream
-
Austin Prock says toughest season may create strongest version of himself
-
Saturday Photo Gallery: Super Grip NHRA Thunder Valley Nationals comes alive
-
Friday Photo Gallery: In the eye of the storm at Super Grip NHRA Thunder Valley Nationals
-
Jordan Vandergriff embraces unique Bristol opportunity this weekend
-
Richard Gadson, Greg Anderson return to Bristol after milestone moments a year ago
-
Teammates Jack Beckman and Jordan Vandergriff looking for big Bristol weekend
-
Dallas Glenn, Angie Smith join WFO Radio to preview upcoming Bristol event

-
Five things we learned at the NHRA New England Nationals presented by bproauto
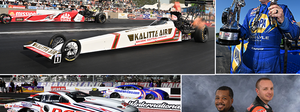
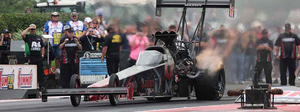
Benchmarking 2024: The numbers to beat in order to contend in Top Fuel
No drag racer wants to be average. Not a single man or woman at any level of this sport decides that they want to arrive at the strip and just be OK that day. From the crew chiefs to the drivers, everyone wants to be exceptional or at least good enough to garner a victory. The neat thing about the statistics the NHRA Nitro Research Dept. keeps is that they allow us to comb back over a few seasons to look at patterns and trends, which can help to set expectations going forward. Hence the nature of this exploratory exercise.
We’ve taken a look back over the season statistics over the last two years to determine just how good one has to be to land in certain areas of the final finishing order, namely first, fifth, and 10th, respectively. Beyond that we were also interested to see where one needed to land on the performance scale to have a strong impact on qualifying position, reaction-time average among the top 12 racers the last two seasons, and even the effect a close championship battle has on what one team needs to do in order to claim championship glory.
Today, we look at Top Fuel.
Qualifying
Obviously, you need to make the field in order to actually compete for a win on Sunday, so what’s the trend been there? Well, in 2022, the average No. 16 qualifying spot was 4.268 seconds over the course of the season. In 2023, that number came all the way down to 4.021. With more cars expected to be running on a full-time basis in 2024, it would not be shocking to see that number, remember the average No. 16 spot, fall into the three-second bracket for the first time in a very long time, if ever. If that happened, we’d be theoretically looking at fields that were separated by less than three-tenths of a second from No. 1 through No. 16.
The majority of the races on the 2024 schedule are four-session events, which is a factor to consider when looking at the 2022/2023 data. More of the 2023 races were four sessions, allowing for potentially better performances with additional cracks at the track.
What about making the middle of the pack? In 2022, Austin Prock was closest to averaging eighth with a 7.64 average qualifying position. He did that while averaging a 3.756 elapsed time. In 2023, it was Prock again, averaging a 7.62 qualifying position, this time running 3.782 for the same piece of real estate. That’s pretty fascinating and rock steady in terms of understanding what a mid-to-high 3.70s car will get you in qualifying. Dead center in the field.
But how about the best qualifiers on the season? In 2022, it was Brittany Force. Her average position was 2.59, and her elapsed time was 3.706. In 2023, Steve Torrence had the best average qualifying spot in Top Fuel at 4.00 and did it with an average e.t. of 3.743.
So, what does any of that tell us? Effectively, it tells us that more cars were vying for that coveted top spot, and that in 2022, Force’s car truly was the monster we thought it was. With a tighter pack shooting for No. 1, even the best average qualifier was 4.00, as Torrence shows us. In 2022, Force had 10 No. 1 qualifiers and the next closest drivers had three. In 2023, the leading drivers both had four, followed by two drivers with three and then three drivers with two. The trend says that there will be more scrapping for No. 1s in 2024 than there was in 2023, and it will be fascinating to see it all break down in the end as to who actually conquers qualifying the hardest.
The Performance Benchmarks
It will surprise no one that things got a little tighter on the starting line between 2022 and 2023, and we expect more of that to happen in 2024. The trend is simply needing to be laser sharp on the Tree, and this was best illustrated by Justin Ashley both years. His season average of .055 in 2022 was shaved to an incredible .046 in 2023. The class average among the top 12 drivers also improved. That went from .068 to .064 for the collective. Amazingly, if you want to be considered an “average” Top Fuel driver now, you need to be .064 or better on the Tree. At no time in the history of the class has it been harder.
Golf and drag racing have one thing in common: They’re close to unique among sports because declining numbers are an indicator that things are getting more difficult. Consider this: Force won 42 rounds in order to capture her 2022 title. Doug Kalitta won 29 to get his 2023 version. Mike Salinas finished fifth each year, but to hold the spot in 2022, he needed 36 round-wins. In 2023, it was 24. Kalitta finished 10th in 2022 with 15 round-wins. Josh Hart finished 10th in 2023 with 15 round-wins.
Again, the fewer round-wins for a championship and fewer to keep a top-five position are all indicative of the growth in performance of the rest of the pack of cars. The more cars that are going late rounds and occasionally winning races, the smaller the number of round-wins we’ll see even out of champions. It’s pretty wild to think that winning the equivalent of nearly four less events still got Kalitta to the top. There were nine winners in 2022, eight in 2023, and the wins were spread more evenly over the eight in 2023. Bottom line? No one got worse, and 2024 is going to be even less forgiving.
If there is one statistic that we look at, which indicates not only how good teams are but the quality of racing in general, it is called the Speed Index. This is a look at how many full runs each team makes. Effectively, we look at the number of passes a car makes and then anything under 4.00 seconds and more than 300 mph is considered a full run.
Two things happened over 2022 and 2023 with this statistic.
The first is that the same guy led it both years. Hart made 66 total runs in 2022 and 87.88% of them were considered full throttle under our metric. In 2023, he made 57 runs with 50 of them being full throttle leading to a full-run percentage of 87.72%.
But the guy finished 10th. How? They just were not fast enough. Consistency is rewarded in Top Fuel only if it comes along with some strength in e.t. and speed.
The class benchmarks? In 2022, the top 12 finishing cars had a Speed Index of 73.97% completed runs. In 2023, it made a move upward as the top 12 averaged 78.32% completed runs. This begins to explain, at its root, some of the other numbers we have mentioned above. More cars making more full runs means tighter competition, round-wins that are harder to come by, and. generally speaking, more diversity of drivers in later rounds on a week-to-week basis.
So, in closing, if you want to win a Top Fuel title, based on the trends of 2022 through 2023, do the following:
- Average an e.t. between 3.70 and 3.735 to keep a qualifying position of 4.00 or better.
- Earn a minimum of 80 qualifying bonus points.
- Be between .046 and .060 on the Tree to be at least within the competitive range of the class.
- Complete at least 80% of your runs under full throttle.
- When completing those runs, maintain an entire season performance average of 3.80-3.85.
- Win at least 32 rounds and, while doing it, win at least four races.
Next installment: The wooly world of Funny Car