


-
Cruz Pedregon chasing first Sonoma Funny Car win in nearly 30 years
-
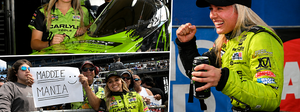
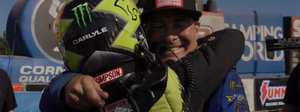
Top Fuel’s most recent winner Maddi Gordon riding high heading to Sonoma
-
Exploring a new stat where semifinals or better are the new eliminations goal
-
Maddi Gordon: The interview
-
Antron Brown on seeing opportunity when the temperature rises
-
Behind the Scenes with the winners of the Summit Racing Equipment NHRA Nationals
-
Midseason review: Battles still raging for regular-season championships
-
Weekend Rewind 2026 Summit Racing Equipment NHRA Nationals
-
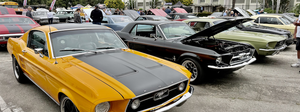
Nearly 150 vehicles fill Wally Parks NHRA Motorsports Museum for June Cars & Coffee
-
Matt Latino chasing first Pro Stock victory while building a winning formula on and off the track
-
As a new team owner, Massey is no longer Spencer for hire
-
Focused and determined, Evaristo has discovered newfound fun in 2026 season
-
Top Fuel’s Clay Millican hoping good vibes in Norwalk lead to win
-
Plenty on the line for Hyde at Summit Racing Equipment NHRA Nationals
-
A slightly different role with the same result as Pruett delivered again with a win
-
What if we told you NHRA's first vice president dominated Pikes Peak in the '60s
-
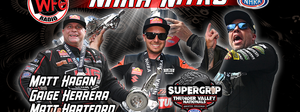
Bristol winners Hagan, Hartford, Herrera join WFO's NHRA Nitro podcast
-
Behind the Scenes with the winners of the Super Grip NHRA Thunder Valley Nationals
-
Weekend Rewind: 2026 Super Grip NHRA Thunder Valley Nationals
-
Five things we learned at the Super Grip NHRA Thunder Valley Nationals
-
Sunday Photo Gallery: Super Grip NHRA Thunder Valley Nationals comes alive
-
Flexjet NHRA Factory Stock Showdown's Raymond Nash is chasing a family dream
-
Austin Prock says toughest season may create strongest version of himself
-
Saturday Photo Gallery: Super Grip NHRA Thunder Valley Nationals comes alive
-
Friday Photo Gallery: In the eye of the storm at Super Grip NHRA Thunder Valley Nationals
-
Jordan Vandergriff embraces unique Bristol opportunity this weekend
-
Richard Gadson, Greg Anderson return to Bristol after milestone moments a year ago
-
Teammates Jack Beckman and Jordan Vandergriff looking for big Bristol weekend
-
Dallas Glenn, Angie Smith join WFO Radio to preview upcoming Bristol event
-
Five things we learned at the NHRA New England Nationals presented by bproauto
Benchmarking 2024: Pro Stock is a study in numerical claustrophobia
We begin this look into what a Pro Stock world championship season has looked like and likely will look like in 2024 with a warning label: If you are fretful about tight spaces, dislike being wedged in among the crowd, or fear being just not quite cool enough to sit at the good table in the cafeteria, you should stop reading. Also, if you happen to be a championship-hopeful Pro Stock competitor and are easily psyched out by large challenges, please follow the illuminated signs to the next available exit from this story.
With that being said, most informed fans of the sport understand that the success and failure margins in Pro Stock are likely to be vastly different than they are in the nitro categories. As we take our look into just how different they are, even the most hardcore of you may be blown away by these findings. Like the last couple of pieces in this series, the numbers here come from the depths of the NHRA Nitro Research and the statistics we use on a week-in and week-out basis for our NHRA on FOX broadcasts compiled largely by Pete Richards, our coordinating producer with FOX Sports. His work is outstanding. As we have done, let’s kick it off with qualifying.
Qualifying
As the car counts have swelled in Pro Stock over the last several seasons, simply making the field has once again become an important part of the life of any competitor’s weekend.
The average bump-spot elapsed time in 2022 was 6.65 seconds. In 2023, it was 6.64 seconds, so we can say with some certainty that if you plan on qualifying in 2024, your car better run mid-6.60s off the trailer to have a fighting chance of making the cut. Once you are in the field, things get even more interesting. The average spread of a Pro Stock field from the first to the 16th qualifier in 2022 was .010-second. In 2023, that number got even smaller to a miniscule .080-second. It’s a tantalizingly small number but also as wide as the Rubicon in some ways. Outside of extreme scenarios, it is too large to make up with a holeshot advantage, and it requires a lot of power to pick up that must performance. That said, .080 can be overcome if your opponent makes anything less than a flawless run.
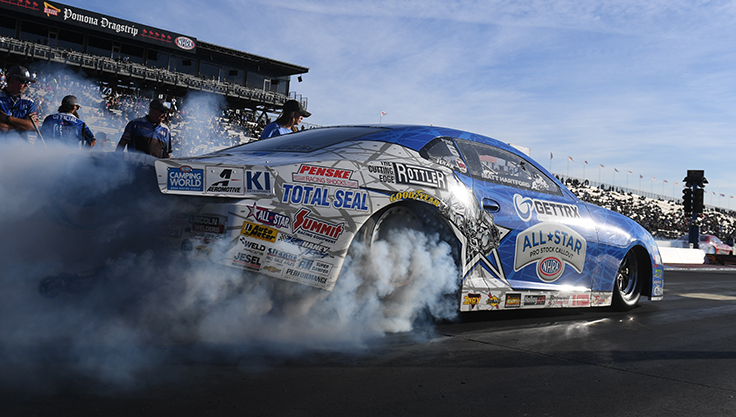
In 2022, Erica Enders was the best qualifier, averaging a 2.58 position over the season. She was No. 1 six times that year. Moving to 2023, she kept that spot, but her average position, still leading the class, fell to 3.59. Enders was No. 1 five times in 2023, one ahead of Matt Hartford’s four. Hartford was the second-best qualifier of the year with an average spot of 5.17.
How about turning those No. 1s into wins?
In 2022, Enders turned six No. 1s into five victories. In 2023, Bristol was the only race she won from that No. 1 position. Hartford was better at this in 2023, turning two of his No. 1s – in Norwalk and Indy – into victories.
It is in the qualifying elapsed time category that we get into the numerical claustrophobia mentioned in the headline. In 2022, Enders had the lowest average qualifying elapsed time at 6.582. In 2023? No surprise, she led the class again with a near-identical 6.583! Hartford was second in 2023 at 6.586, and the rest of the field also was stuck together like glue.
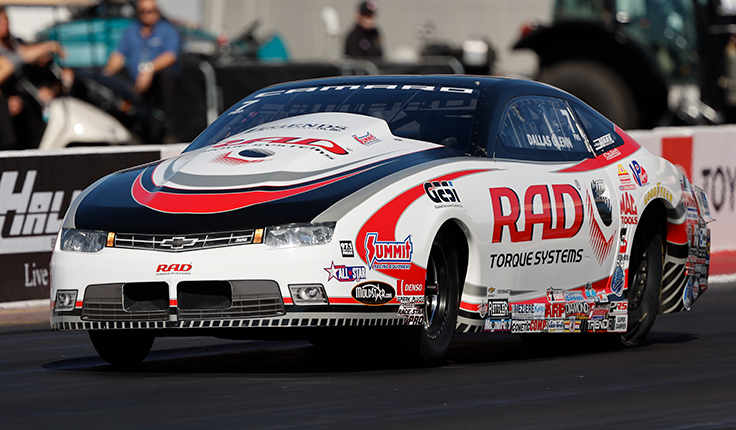
In 2022 and 2023, Dallas Glenn had the fifth-best average in class: 6.601 in 2022 and 6.594 in 2023. How about the 10th best? Cristian Cuadra in 2022 with a 6.619 and Bo Butner in 2023 with a 6.600.
That’s pretty wild.
The Difference on Race Day
As tight as the qualifying numbers are, the statistics generated on Sundays are even more bonkers.
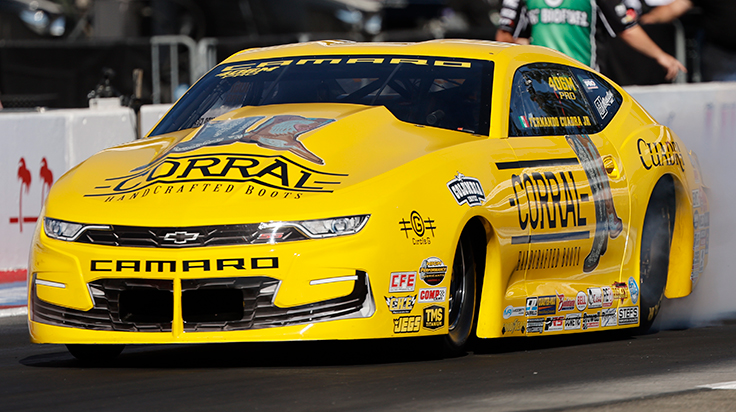
Beginning where many Pro Stock pairings are won or lost, on the starting line, Fernando Cuadra Jr. had the best reaction-time average of 2022 with a blazing .023. Glenn was right on his heels at .025, and Hartford rounded out the top three with a .028. In 2023? There were three people tied at the top with a .030 average. Incredibly, Glenn, Jerry Tucker, and Aaron Stanfield were in a three-way tie for first. Kyle Koretsky was fourth with a .031 average.
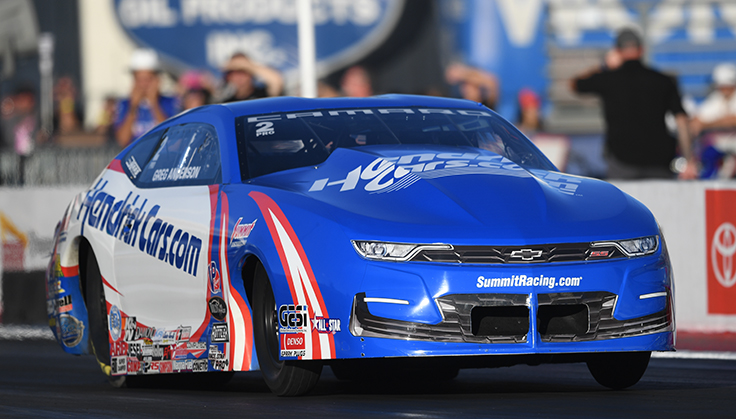
In terms of race-day performance, Greg Anderson was the top in 2022 with an average Sunday elapsed time of 6.662 seconds, followed by Enders at 6.676. In 2023, the vice squeezed even harder. Stanfield was the quickest person on average, running 6.664 with Anderson behind him at 6.696.
If this is true, how did Stanfield finish fourth in the points? His Countdown to the Championship included two second-round losses and a first-round loss. Despite his other successes, it knocked him backward in the finishing order.
One of the most drastic changes year to year comes in the round-win count. In 2022, Enders won 10 races and amassed 55 round-wins. The next closest was Stanfield with 38 and Anderson with 31.
In 2023, Glenn had the most round-wins with 35, while Enders had 32 and won a championship with 23 fewer round-wins than she had the previous year. Hartford, who finished third in the points, had 31 round-wins.
Going from a 10-win runaway season to a four-win campaign that only had relief late in the Countdown is a drastic difference but ultimately led to the same result.
Lastly, we look at the Speed Index, as we have done with the nitro categories. Herein lies the vastest difference between the two forms of drag racing. We benchmarked Funny Cars as needing to finish a season with an 80% Speed Index rating to be truly competitive in a championship sense. If you do that in a Pro Stock car, you may want to pick up a new profession.
In 2022, unsurprisingly, the champion led this statistic. Enders had a 95.4% Speed Index rating, meaning that of 83 competition runs made during the season (all Sunday runs and the qualifying run of record) she completed 79 of them with the hammer down. In 2023, Glenn ruled the roost here as his 95.5% rating was the best in class. In both years, the drop between No. 1 and No. 2 was 4-5%. In 2022, Hartford was second in this category with a 90.7% rating, and in 2023, Stanfield was second, carrying a 91.6% Speed Index. Where did Enders land? Fifth, largely because of the morass the team was stuck in through the first half dozen races of 2023.
So, what do the numbers tell us about how to win a 2024 championship?
- Qualify with an average hovering around three
- Average a qualifying elapsed time between 6.58 and 6.60
- Maintain a season reaction-time average of NO WORSE than .030 (yikes!)
- Maintain an eliminations e.t. average of 6.66-6.67
- Win at least 35 rounds of competition
- Convert a minimum of two No. 1 qualifying positions into victories
- Complete a MINIMUM of 96% of competition runs at full throttle
Can it get any harder? Three words say yes: Pro Stock Motorcycle, which is up next.
Previously: