


-
NHRA Power Rankings: Matt Hagan still quick, fast despite slow start to 2020
-
NHRA Power Rankings: Nobody quicker in Top Fuel than Brittany Force, David Grubnic
-
NHRA Power Rankings: Champions top charts in Pomona
-
NHRA Power Rankings: Matt Hagan hung around for one last shot in Pomona
-
NHRA Power Rankings: Good things on the horizon for Jordan Vandergriff
-
NHRA Power Rankings: David Grubnic, Brittany Force on right path in first season together
-
NHRA Power Rankings: It pays to have great drivers
-
NHRA Power Rankings: Jason Line leads Pro Stock in more ways than one
-
NHRA Power Rankings: Doug Kalitta can beat Steve Torrence with a little luck
-
NHRA Power Rankings: Ron Capps is starting to make it feel a lot like 2016
-
NHRA Power Rankings: Jeg Coughlin Jr. and Erica Enders just need luck to go their way
-
NHRA Power Rankings: Billy Torrence keeps things interesting with his NHRA Sonoma Nationals win
-
NHRA Power Rankings: What the last six races can tell us about Greg Anderson, Tommy Johnson Jr. and the Countdown to the Championship
-
NHRA Power Rankings: Scott Palmer makes renewed NHRA Countdown bid
-
NHRA Power Rankings: Is Deric Kramer poised for a championship chase?
-
NHRA Power Rankings: Aggression pays off for Bob Tasca III and Mike Salinas
-
NHRA Power Rankings: Is Billy Torrence going to make the Countdown to the Championship?
-
NHRA Power Rankings: Erica Enders, Andrew Hines take over top spots following Route 66 NHRA Nationals
-
NHRA Power Rankings: Bo Butner wins again, highlights great K.B. Racing weekend
-
NHRA Power Rankings: Doug Kalitta, Tim Wilkerson, Andrew Hines have reason for optimism after Arby's NHRA Southern Nationals
-
NHRA Power Rankings: Tim Wilkerson, Mike Salinas, Jerry Savoie biggest movers
-
NHRA Power Rankings Explained: Getting to know the newest drag racing stat
-
Power Rankings: Robert Hight flexes again following SpringNationals victory
-
NHRA Power Rankings: Leaders hold position after Las Vegas Four Wide
-
Power Rankings: Jeg Coughlin, Eddie Krawiec new leaders in Pro Stock, Pro Stock Motorcycle
-
Robert Hight, Steve Torrence, Erica Enders lead NHRA Power Rankings following NHRA Arizona Nationals
-
Steve Torrence, Tommy Johnson Jr., Erica Enders top first Power Rankings update of 2019

NHRA Power Rankings: Doug Kalitta, Tim Wilkerson, Andrew Hines have reason for optimism after Arby's NHRA Southern Nationals
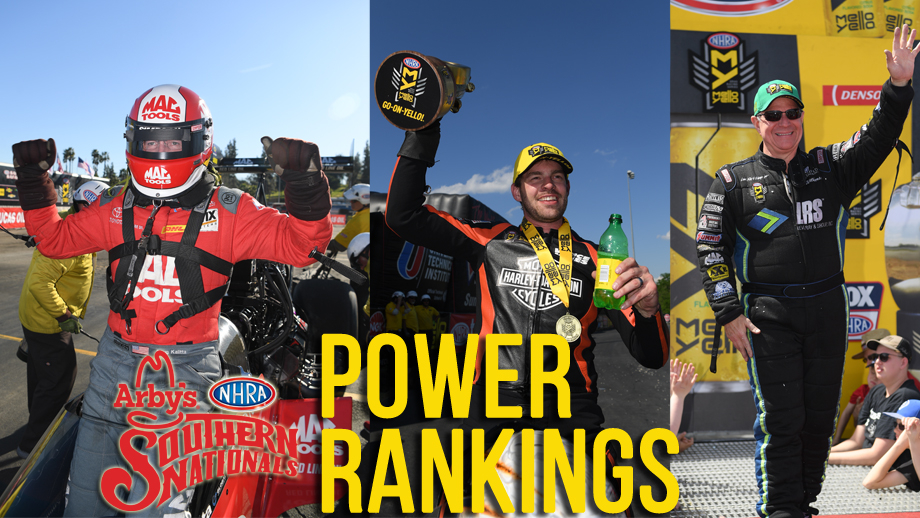
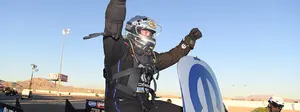
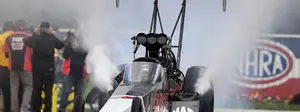
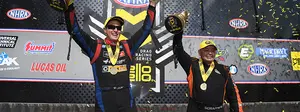
Doug Kalitta lost in the first round at the Arby’s NHRA Southern Nationals. His 4.208-second pass hurt his overall success rate and, more importantly to the Mac Tools team, ended his weekend three rounds early. But his NHRA Power Ranking went up and Kalitta now sits just behind leader (in points and Power Ranking) Steve Torrence.
So, how come? Crew chief Troy Fasching has taken the Mac Tools dragster up 33 points since the start of the season by vastly improving its speed and consistency. Kalitta now boasts the quickest dragster in Top Fuel and it gets down the track 76 percent of the time. That’s .003-second quicker than Torrence and just a little behind on consistency (you can see the full chart for all four Mello Yello categories here).
But that doesn’t explain why Kalitta’s Power Ranking increased. He qualified No. 3 and had a couple of strong passes, but mostly maintained his overall season performance. We’re seven races into the season, which means you’re less likely to see major swings unless something truly wild happens (stringing together eight great runs in one weekend might do it). But Power Rankings aren’t measured against what you did last week, they’re measured against class performance.
Racing at Atlanta Dragway was a big test for drivers and crew chiefs because of changing track conditions due to many different weather conditions. Fasching and the Mac Tools team did a phenomenal job managing the weather and kept their dragster running at pace while the overall class average dipped into the 3.80s. Kalitta staying on target provided a boost to his Power Ranking and allowed him to pass two racers who were inactive (Billy Torrence and Mike Salinas) and got him a little closer to Steve Torrence.
| Ranking | Driver | Elapsed Time | Success Rate | Reaction Time | Average Speed | Power Ranking | Point Change | Position Change |
|---|---|---|---|---|---|---|---|---|
| 1 | Steve Torrence | 3.757 | 81% | 0.071 | 325.10 | 73.89 | -0.49 | 0 |
| 2 | Doug Kalitta | 3.754 | 76% | 0.060 | 322.08 | 69.81 | 9.30 | 3 |
| 3 | Billy Torrence | 3.767 | 78% | 0.073 | 325.76 | 69.40 | 5.32 | 0 |
| 4 | Mike Salinas | 3.757 | 76% | 0.087 | 326.55 | 67.34 | 1.81 | -2 |
| 5 | Antron Brown | 3.774 | 63% | 0.061 | 324.60 | 59.34 | 3.24 | 1 |
| 6 | Jordan Vandergriff | 3.775 | 70% | 0.068 | 322.44 | 57.63 | -3.09 | -2 |
| 7 | Terry McMillen | 3.767 | 61% | 0.069 | 324.31 | 56.95 | 4.43 | 1 |
| 8 | Leah Pritchett | 3.781 | 67% | 0.075 | 323.98 | 53.38 | 0.86 | -1 |
| 9 | Brittany Force | 3.774 | 70% | 0.079 | 318.16 | 47.32 | -4.34 | 0 |
| 10 | Austin Prock | 3.800 | 60% | 0.057 | 322.21 | 45.92 | -5.74 | 0 |
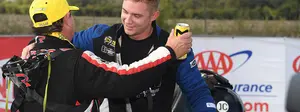
Tim Wilkerson reached another final round and has improved by 13.31 points since the start of the season. A terrible start to the season at the Winternationals is a distant memory for the Ford Mustang Funny Car racer. He’s averaging a 3.99-second elapsed time, he’s getting down the track 57 percent of the time (nearly up to his 2018 average of 62.2 percent) and his average speed of 321.76 mph speaks to his potential.
Wilkerson came up short against Ron Capps, who moved back into the top 10 this week after a tough stretch to start the season, but he’s a reliable threat on race day. The Rahn Tobler-tuned NAPA Funny Car of Capps is moving in the right direction, too, though it remains down on speed; how much that matters remains to be seen. Capps picked up 8.1 points this week and the car is among the more consistent in the bottom half of the top 10, it’s just not particularly quick.
Matt Hagan has made one of the biggest moves this season after a very difficult Countdown to the Championship in 2018. Dickie Venables has the most consistent Funny Car. Jimmy Prock has tuned Robert Hight to the third-most consistent. It’s just not accurate to say Prock and Venables are “swing for the fences” guys in the sense we used to – yes, they run quick cars, but they’re also getting down the track more often than almost everyone else.
| Ranking | Driver | Elapsed Time | Success Rate | Reaction Time | Average Speed | Power Ranking | Point Change | Position Change |
|---|---|---|---|---|---|---|---|---|
| 1 | Robert Hight | 3.953 | 78% | 0.073 | 324.50 | 79.34 | -8.62 | 0 |
| 2 | Matt Hagan | 3.966 | 83% | 0.078 | 321.03 | 71.74 | 9.24 | 0 |
| 3 | John Force | 4.006 | 81% | 0.074 | 322.87 | 62.84 | 5.77 | 0 |
| 4 | Jack Beckman | 3.993 | 62% | 0.076 | 322.85 | 54.73 | -0.94 | 0 |
| 5 | Shawn Langdon | 4.017 | 68% | 0.064 | 320.06 | 51.02 | 4.75 | 1 |
| 6 | Tim Wilkerson | 3.990 | 57% | 0.084 | 321.76 | 49.01 | 2.55 | -1 |
| 7 | J.R. Todd | 4.010 | 60% | 0.066 | 320.69 | 48.21 | 7.03 | 0 |
| 8 | Bob Tasca III | 4.016 | 67% | 0.065 | 317.68 | 46.48 | 9.34 | 2 |
| 9 | Cruz Pedregon | 4.011 | 56% | 0.068 | 321.21 | 45.98 | 5.80 | -1 |
| 10 | Ron Capps | 4.011 | 68% | 0.073 | 316.79 | 45.10 | 8.10 | NR |
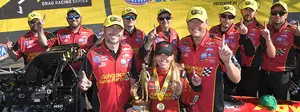
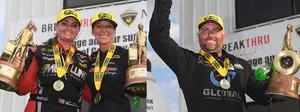
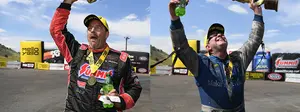
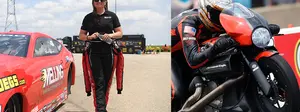
Andrew Hines picked up another 10.23 points following the Arby’s NHRA Southern Nationals and it won’t be long before he passes teammate Eddie Krawiec if things continue this way. Hines is riding a new chassis with the same body styling as his two Harley-Davidson teammates and it’s been an incredible machine. He notched a 1.054-second 60-foot time in the final to defeat Jerry Savoie, and without getting too technical: That’s very bad news for everyone else in Pro Stock Motorcycle.
Krawiec may get the new chassis in Richmond ahead of the Virginia NHRA Nationals, but even if he does, it may take time for it to get properly tuned. Regardless, the Vance & Hines Harley-Davidson squad is the cream of the crop in the class while Matt Smith Racing struggles to get its team to the 60-foot clock in a reasonable amount of time.
Joey Gladstone picked up six spots thanks in part to dropping off old results (we’re still working with races from 2018 in the Pro Stock and Pro Stock Motorcycle categories) and because he and Cory Reed have put together a decent package thus far. The bike has become relatively reliable and he gets off the line quicker than just about everyone in the category (Karen Stoffer, who also moved up three spots, is .001 second quicker).
| Ranking | Driver | Elapsed Time | Success Rate | Reaction Time | Average Speed | Power Ranking | Point Change | Position Change |
|---|---|---|---|---|---|---|---|---|
| 1 | Eddie Krawiec | 6.863 | 100% | 0.036 | 196.60 | 85.78 | 7.87 | 0 |
| 2 | Andrew Hines | 6.853 | 80% | 0.040 | 195.67 | 77.38 | 10.23 | 2 |
| 3 | Matt Smith | 6.856 | 82% | 0.044 | 197.14 | 75.19 | -0.31 | -1 |
| 4 | Hector Arana Jr | 6.885 | 95% | 0.054 | 196.18 | 74.78 | 6.27 | -1 |
| 5 | Jerry Savoie | 6.901 | 77% | 0.041 | 193.26 | 58.88 | 7.73 | 2 |
| 6 | Joey Gladstone | 6.892 | 68% | 0.029 | 193.43 | 55.41 | 0 | 6 |
| 7 | Angelle Sampey | 6.902 | 71% | 0.062 | 193.66 | 48.44 | 0 | -1 |
| 8 | Hector Arana | 6.900 | 63% | 0.040 | 195.22 | 45.58 | -4.18 | -3 |
| 9 | Ryan Oehler | 6.915 | 74% | 0.051 | 194.91 | 45.20 | 0 | 2 |
| 10 | Karen Stoffer | 6.912 | 60% | 0.028 | 192.75 | 43.19 | 0 | 3 |
We’ll get back on track in Richmond in two weeks. I’m looking forward to seeing you there!